Truckcom XT provides the functionality to create various Dashboards that can be set up to show different widgets containing a number of percentage of items for various search criteria. These can be useful for seeing at a glance various metrics that are updated throughout the day. Thresholds can be set up to colour these widgets when the result is above/below a given amount.
Dashboards are set up using Custom Searches against various datasets. This will be explained later on, if you require any help getting these custom searches created for use with the dashboards then please Contact Us
This is an example of a Dashboard showing various information about the status of jobs for the current day.

You can access the Dashboards area of Truckcom XT by hovering over the Reports menu option and selecting Dashboards.
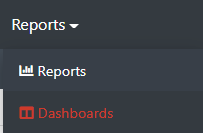
From here you are able to add a new Dashboard by clicking on the Add Item button. You can create multiple dashboards that can display various data widgets as required. These will be visible to all of your companies office users, but will only be able to be edited by the creator or owner of the dashboard.
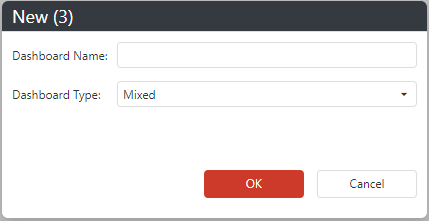
When the Add Item button is clicked you will see the following form. Give your dashboard a name here and select from one of the Dashboard Type options. For this example we will select Mixed.
- Mixed – the dashboard can contain data from various sources
- Driver – the dashboard can only contain data related to Drivers (you will be able to specify an additional Driver Group filter to the dashboard)
- Job – the dashboard can only contain data related to Jobs (you will be able to specify an additional Customer filter to the dashboard)
After clicking OK you will then see a new entry in the grid, with the name you entered for the dashboard. Right click on the row and select View Dashboard to add some data to it.
The dashboard will be opened up in a new browser tab, to start with it will be blank.
To add the first widget to it click on the red Add New Widget Button at the bottom right of the screen.
![]()
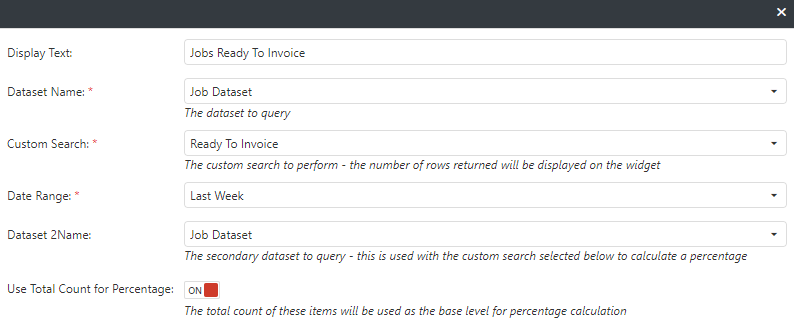
The Add New Widget form will then be displayed with various fields to be entered to set up this widget.
Display Text – This will be displayed at the top of the widget, it can be left blank.
Dataset Name – Select one of the available datasets from the list. This will affect what data you are displaying in the widget, if you need help choosing please let us know.
Custom Search – Select one of the available custom searches from the list. These are linked directly to the dataset chosen above. You can set these up from the various grids within in XT, for example you can add a custom search to the Job Dataset from the Jobs grid.
Date Range – Select a date range option from the list. This will be used when querying the data for this widget. This can be overridden at a dashboard level, more on this later.
Dataset 2 Name – The same as Dataset Name, select this if you wish to display a percentage in this widget. The data from the first dataset query will be divided by the result of this query. This can be left blank.
Total Number Custom Search – Select one of the available custom searches from the list to be used to calculate the total. Linked to the dataset selected above and only required if a percentage is required.
Use Total Count for Percentage – If you wish to use the total count of the items returned from the Dataset 2 query as base of the percentage. This overrides the custom search selected above.
In the example dashboard below we have set it up to show the percentage of jobs from the last week that are Ready to Invoice. This will display the percentage of jobs that are returned by the first custom search out of the total number of jobs that exist.
The following section of the form can be used to specify the widgets appearance if required.
Background Colour – select the colour for the background of the widget
Text Colour – select either Black or White depending on the background colour selected above so the text is visible.
Widget Width – enter a percentage of the screen to set the widget width. If you want to display 4 widgets in a row regardless of screen size enter “25%” here. This can be left blank to use the default widget size.
The final section of the form allows you to set up Low and High Thresholds as required which will change the colour of the widget.
Low Threshold Value – enter a number here, if the result of the query for this widget is lower than this the colour selected below will be set.
Low Threshold Colour – select the colour to change the background to
High Threshold Value – enter a number here, if the result of the query for this widget is higher than this the colour selected below will be set.
High Threshold Colour – select the colour to change the background to
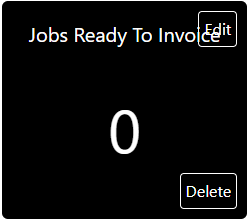
Once created you will see this widget displayed on the screen. If you hover over this you will see both the Edit and Delete options. To add more widgets repeat the previous steps.
A dashboard level date filter can be set using the controls at the top of the screen, as mentioned previously selecting a Driver/Job specific dashboard will allow you to set specific filters as well.
![]()
It may be useful to know that you can minimise the Truckcom menu bar by clicking the arrow icon in the top right area of the screen.

By doing this you will have more space to display the dashboard content, which may be useful if you wish to display this on a monitor/tv screen visible to multiple users. The content of the dashboard will be automatically refreshed every minute.
If you have any questions or need any assistance please Contact Us


